Câu hỏi/bài tập:
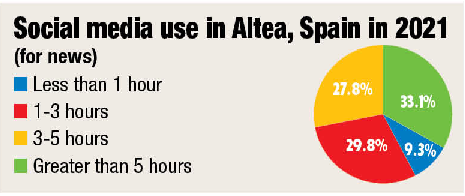
3. Read the pie chart about television viewers in the Spanish village and match the questions with the answers.
(Đọc biểu đồ tròn về số người xem ti vi ở một làng ở Tây Ban Nha và nối các câu hỏi với câu trả lời.)
(Việc sử dụng tivi ở Altea, Tây Ban Nha trong năm 2022 (dành cho tin tức và giải trí)
(235 phản hồi ở Altea, Tây Ban Nha)
ít hơn 1 tiếng; 1 đến 2 tiếng; 3 đến 5 tiếng; nhiều hơn 5 tiếng
|
1. ___ What does the chart show? 2. ___ What is the visible trend that the chart indicates? 3. ___ What is the main conclusion that can be drawn regarding the results of the chart? |
a. People in the village most likely to reply on television as their primary source of news and entertainment. b. Most residents of the village spent long hours using television to get their news and for entertainment, while those who spent little time in front of the TV accounted for only 8% of total use in the area. Advertisements (Quảng cáo) c. The amount of time spent on watching television. |

|
1. c |
2. a |
3. b |
1-c: What does the chart show? The amount of time spent on watching television.
(Biểu đồ cho thấy gì? Thời lượng dành ra để xem ti vi?)
2-a: What is the visible trend that the chart indicates? People in the village most likely to reply on television as their primary source of news and entertainment.
(Xu hướng nào ta có thể nhìn thấy được mà biểu đồ chỉ ra? Mọi người trong làng hầu hết sẽ phản hồi tivi là nguồn tin tức và giải trí chính của họ.)
3-b: What is the main conclusion that can be drawn regarding the results of the chart? Most residents of the village spent long hours using television to get their news and for entertainment, while those who spent little time in front of the TV accounted for only 8% of total use in the area.
(Kết luận chính có thể vẽ ra theo kết quả của biểu đồ là gì? Hầu hết các dư dân ở làng dành nhiều giờ để xem ti vi để cập nhật tin tức và giải trí, trong khi những người dành ít thời gian xem ti vi chỉ chiếm có 8% tổng lượng sử dụng trong khu vực.)