Câu hỏi/bài tập:
Writing(Viết)
Writing a pie chart report(Viết một báo cáo biểu đồ tròn)
5. Read the report and put the paragraphs in the correct order.
(Đọc báo cáo và xếp các đoạn văn theo thứ tự đúng.)
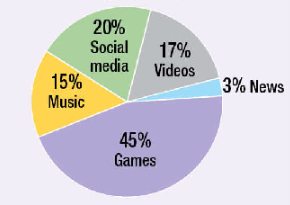
Tablet use in the people aged 18-23 in York.
45% Games (45% trò chơi)
20% Social media (20% mạng xã hội)
17% Video (17% xem vi-đê-ô)
15% Music (15% âm nhạc)
3% News (3% tin tức)
A. ___ All in all, it is clear from the data gathered above that the majority of young tablet users prefer to play games and use social media, whereas a very small percentage of them listen to music or read the news online.
Advertisements (Quảng cáo)
B. ___ This chart illustrates the results of a recent survey about tablet use conducted in York. It categorises tablet use by types of activities. Overall, the graph indicates a visible trend that children and young adults play games on their tablets.
C. ___ With reference to the most significant portion of the chart, playing games accounts for 45% of the users. Next to that, with a lower portion of the total, 20% of young users use tablets to go on social media. On the other hand, those who watch videos make up only 17% of the young population. Furthermore, we should take note of the fact that only 15% and 3% of young users listen to music and read the news on their tablets, respectively.

|
A. 3 |
B. 1 |
C. 2 |
This chart illustrates the results of a recent survey about tablet use conducted in York. It categorises tablet use by types of activities. Overall, the graph indicates a visible trend that children and young adults play games on their tablets.
With reference to the most significant portion of the chart, playing games accounts for 45% of the users. Next to that, with a lower portion of the total, 20% of young users use tablets to go on social media. On the other hand, those who watch videos make up only 17% of the young population. Furthermore, we should take note of the fact that only 15% and 3% of young users listen to music and read the news on their tablets, respectively.
All in all, it is clear from the data gathered above that the majority of young tablet users prefer to play games and use social media, whereas a very small percentage of them listen to music or read the news online.
(Biểu đồ này thể hiện kết quả của một cuộc khảo sát gần đây về việc sử dụng máy tính bảng được tiến hành ở York. Nó phân loại việc sử dụng máy tính bảng theo loại hoạt động. Nhìn chung, biểu đồ cho thấy xu hướng rõ ràng là trẻ em và thanh niên chơi trò chơi trên máy tính bảng của họ.
Liên quan đến phần quan trọng nhất của biểu đồ, chơi trò chơi chiếm 45% số người dùng. Bên cạnh đó, với tỷ lệ thấp hơn trong tổng số, 20% người dùng trẻ tuổi sử dụng máy tính bảng để truy cập mạng xã hội. Mặt khác, những người xem video chỉ chiếm 17% dân số trẻ. Hơn nữa, chúng ta nên lưu ý rằng chỉ có 15% và 3% người dùng trẻ tuổi nghe nhạc và đọc tin tức trên máy tính bảng của họ.
Nhìn chung, dữ liệu thu thập ở trên cho thấy rõ rằng phần lớn người dùng máy tính bảng trẻ tuổi thích chơi trò chơi và sử dụng mạng xã hội, trong khi một tỷ lệ rất nhỏ trong số họ nghe nhạc hoặc đọc tin tức trực tuyến.)